Market Watch
Beyond the S&P 500: How Factor Investing Changes the Way Investors Own U.S. Equities

For decades, investing in the S&P 500 has been one of the simplest and most successful ways to participate in the growth of corporate America. The proposition is straightforward: gain exposure to approximately 500 of the largest U.S. companies and allow market capitalisation to determine how much influence each company has on the portfolio.
It is an elegant strategy. But it is not the only way to own U.S. equities.
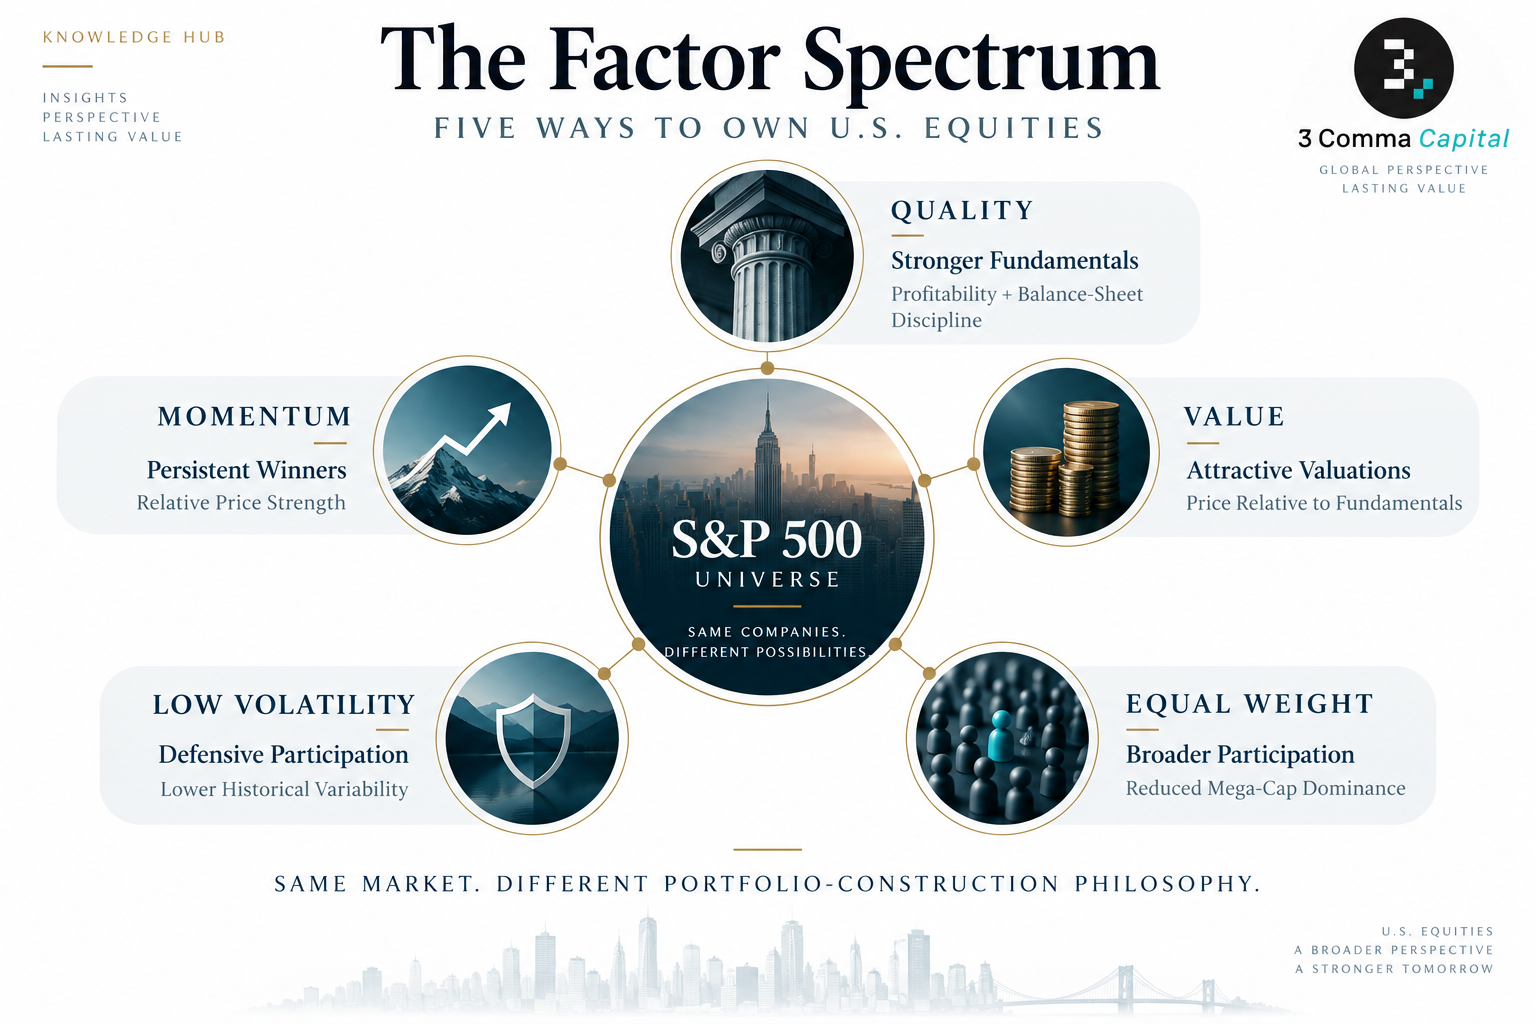
Behind the headline index sits an increasingly sophisticated family of strategies that invest in many of the same companies while allocating capital according to very different characteristics. Some favour companies with stronger profitability and balance sheets. Others favour stocks exhibiting persistent price momentum. Some deliberately reduce exposure to volatile companies, while others focus on attractive valuations or reduce the dominance of the largest companies altogether.
These are commonly known as factor strategies. Their importance has grown as investors have become more aware that owning hundreds of stocks does not necessarily mean being broadly diversified across sources of return.
A market-cap-weighted portfolio can still be highly dependent on a relatively small number of mega-cap companies, sectors or investment styles.
Factor investing offers another way to think about U.S. equity exposure: not simply whether to own the S&P 500, but how to own it.
In reality, it incorporates an important portfolio-construction decision: companies are predominantly weighted according to their float-adjusted market capitalisation. As a company's market value increases, its influence on the index generally increases as well. This approach has significant advantages. Market-cap weighting is transparent, highly scalable and relatively inexpensive to replicate. It also allows successful companies to naturally become larger components of the portfolio.
But it has consequences.
When a relatively small number of very large companies dominate market performance, they also become increasingly important to the index. An investor can therefore own hundreds of companies while a considerably smaller number account for a significant proportion of portfolio performance and risk.
Factor investing begins with a different question: What happens if we continue investing in leading U.S. companies, but determine portfolio exposure using characteristics other than company size?
S&P's August 2026 dashboard measures factors including Volatility, Momentum, Value, Beta, Dividend, Quality and Size, while its macroeconomic study examines Quality, Momentum, Growth, Value, Dividend, Low Volatility and Size.
The important word is systematically.
Factor investing sits between traditional passive and active management. Like passive investing, factor indices follow predefined and transparent methodologies. But like active management, those methodologies deliberately favour some securities over others:
Factor indices are therefore better understood as rules-based portfolio-construction strategies rather than neutral representations of the market.
The intuition is straightforward. Companies with stronger profitability, cleaner earnings and healthier balance sheets may be better positioned to compound earnings over long periods and withstand periods of economic stress.
The trade-off is valuation. High-quality businesses are often widely recognised as such, which means investors may have to pay higher prices for them.
Quality asks: Which companies combine profitability with financial strength?
Rather than asking whether a company is cheap or financially stronger, Momentum focuses on persistent price leadership. The S&P 500 Momentum Index measures 12-month risk-adjusted momentum. The factor dashboard describes Momentum using the total return over the prior 12 months, excluding the most recent month, adjusted for volatility.
The investment logic is behavioural as much as fundamental. Market trends can persist because information is incorporated gradually, investor positioning adjusts slowly and successful companies can continue to attract capital.
Recent performance illustrates the potential power of the factor: Momentum returned 46.0% in 2024, 26.9% in 2025 and 23.9% through August 2026, compared with 25.0%, 17.9% and 13.1%, respectively, for the S&P 500.
But Momentum also carries reversal risk. A strategy built around persistent winners can suffer when market leadership changes abruptly.
Momentum asks: Which companies are demonstrating the strongest persistent market trends?
S&P's Value factor measurement combines earnings-to-price, book-to-price and sales-to-price measures. The objective is to identify companies whose prices appear attractive relative to their underlying fundamentals.
Value therefore often directs capital toward securities that investors have neglected or discounted. The underlying thesis is that markets can become excessively pessimistic and that valuations may eventually normalise as expectations or fundamentals improve.
But low valuations can persist. And some companies are inexpensive because their businesses genuinely face structural problems.
Value asks: Where are investors paying the least for underlying fundamentals?
The S&P 500 Low Volatility Index selects 100 constituents and weights them inversely according to realised volatility. Its objective is not necessarily to outperform during powerful bull markets.
It is to participate differently.
The annual performance data make that contrast very clear: In 2022, when the S&P 500 declined 18.1%, Low Volatility declined only 4.6%.
But in 2023, when the S&P 500 rebounded 26.3%, Low Volatility returned only 0.7%.
That is the strategy in miniature. It may give up some upside participation in exchange for more defensive characteristics.
Low Volatility asks: Can investors maintain equity exposure while reducing sensitivity to market swings?
S&P's macroeconomic study characterises the S&P 500 Equal Weight Index as holding all 500 constituents with equal weighting. The result is substantially lower mega-cap concentration and greater relative exposure to smaller companies within the S&P 500 universe.
It also introduces a systematic rebalancing mechanism.
Companies that have risen strongly become overweight relative to the equal-weight target and are trimmed. Relative laggards are increased back toward equal weight.
Equal Weight should therefore not be viewed simply as a less concentrated S&P 500. Its size exposure and rebalancing discipline can lead to materially different outcomes.
Equal Weight asks: What happens when company size no longer determines portfolio importance?
Historical results show why it is not.
The S&P Factor Dashboard presents annual returns for core factors going back to 2011. The more recent period illustrates just how dramatically leadership can rotate.
*2026 through August 31. Total returns in U.S. dollars. Source: S&P Dow Jones Indices.
The pattern is more important than any individual number:
And the traditional S&P 500 itself has often been the strongest option.
There is no permanent winner. That is one of the most important lessons of factor investing.
The framework is deliberately simple.
Growth is classified as rising or falling using monthly changes in the OECD U.S. Composite Leading Indicator.
Inflation is classified as rising or falling by comparing the three-month average of U.S. CPI with its three-year moving average.
To reduce noise, a regime must persist for at least three months before being recognised.
This produces four environments:
The results are revealing. Across the full period, the S&P 500 itself generated its strongest historical annualised performance in the Rising Growth + Falling Inflation regime and its weakest performance in the Falling Growth + Rising Inflation regime.
Factor leadership also changed materially from one regime to another.
The S&P study found Pure Growth to be the strongest active factor in this environment, generating an average monthly excess return of 0.58% over the S&P 500 with an outperformance hit ratio of 63%.
Low Volatility was the weakest factor, with an average monthly excess return of -0.85% and an outperformance hit ratio of only 33%.
The intuition is relatively straightforward.
Improving growth and declining inflation can support corporate earnings while easing pressure on discount rates and financial conditions. In such an environment, investors have historically been willing to reward growth and market leadership rather than defensive characteristics.
S&P found Momentum generated an average monthly excess return of 1.07%, the strongest result among the factors examined in that regime, with an outperformance hit ratio of 63%.
Low Volatility again lagged, with an average excess return of -0.82%.
Momentum's historical strength in this environment is consistent with the idea that persistent market leadership can continue even as inflationary pressures build, provided economic activity remains strong.
Pure Value was the weakest factor, with an average monthly excess return of -0.75%.
This is particularly relevant because it reveals a defensive dimension to Quality.
Quality is not simply about owning fundamentally stronger companies. Historically, its relative performance has improved when economic growth weakened.
In this environment, Low Volatility was the strongest factor in S&P's study, generating an average monthly excess return of 1.19% and outperforming the S&P 500 in 64% of months. High Dividend also performed strongly, while Quality remained positive. Pure Growth and Momentum, by contrast, were among the weaker strategies.
The broader lesson is clear: different factors provide exposure to different economic risks.
Growth and Momentum have historically benefited more from improving economic activity. Quality and Low Volatility have tended to become more useful as growth weakened. Dividend strategies have historically become more attractive in some environments where investors placed greater emphasis on income and stability.
Why not simply own Momentum when growth is improving, switch into Low Volatility as the cycle deteriorates and rotate into Value when the recovery begins?
Because investors only know the regime with certainty after much of the market adjustment may already have occurred.
Markets are forward-looking. Economic data is revised. Policy changes can alter conditions rapidly. And factor performance can turn before macroeconomic indicators provide a clear signal.
The S&P research itself illustrates the problem:
An investor who simply buys the factor that has performed best recently may therefore position the portfolio for the regime that is already ending. This is factor timing risk.
Knowing that regimes exist is not the same as being able to predict their turning points consistently. That is one reason diversification across factors can be more robust than attempting to identify the next winner.
Quality, Value and Momentum (QVM) are particularly complementary conceptually:
Combining the three can create a more balanced selection framework.
Rather than asking only:
Is this a strong business?
or:
Is this company cheap?
or:
Is its share price performing strongly?
a multi-factor strategy can ask: Which companies offer the strongest combination of fundamental quality, valuation and market behaviour?
The objective is not to guarantee outperformance. It is to reduce dependence on any single factor remaining in favour.
This creates three broad approaches:
These approaches solve different problems:
None eliminates risk. They simply allocate it differently.
For example, the Quality Index was launched in 2014, Momentum in 2014 and Low Volatility in 2011. Performance before those dates is therefore hypothetical and back-tested. Back-tested results benefit from hindsight and do not represent actual investment experience.
Historical research remains useful. It should not be mistaken for a live track record.
Modern portfolio construction asks another question: What is actually driving their returns?
Consider an investor who holds the S&P 500, the Nasdaq 100 and a U.S. technology fund. On paper, that investor owns three different investments.
Economically, however, all three may depend heavily on many of the same mega-cap companies, valuation assumptions and growth expectations. The number of holdings alone therefore tells us relatively little about genuine diversification.
Factor investing introduces another dimension:
Investors can therefore diversify not only what they own, but also why those investments are expected to generate returns.
That distinction matters. Factor diversification is not necessarily a bearish view on the S&P 500. Nor does it forecast an end to mega-cap leadership.
It is about diversifying the architecture of U.S. equity exposure itself:
Multi-factor strategies can combine several of these characteristics rather than relying excessively on a single style or economic regime. The objective is not to predict which factor will outperform next month.
It is to recognise that each factor responds differently to the underlying economic environment.
Factor investing makes that distinction increasingly incomplete. Investors can now access systematic portfolios designed around profitability, valuation, momentum, volatility, dividends, company size and combinations of several characteristics.
These strategies remain rules-based. But they are not neutral. Every methodology expresses a view about which characteristics should determine portfolio exposure.
Market-cap weighting expresses one view.
Equal weighting expresses another.
Quality, Momentum, Value and Low Volatility each express others.
The more useful question is therefore no longer simply: Active or passive?
It is increasingly: Which portfolio-construction methodology best reflects the risks and returns the investor actually wants to own?
It also demonstrates something more important: there is no permanently superior factor:
The opportunity is therefore not necessarily to identify the next winning factor. It is to recognise that different portfolio characteristics respond differently to different economic environments.
And if investors cannot reliably know which environment will dominate next, diversifying factor exposures may be more robust than attempting to forecast the next winner. For long-term investors seeking exposure to corporate America, the question may therefore no longer be simply whether to own the S&P 500.
It may also be:
How do you want to own it?
Source and Risk Note
It is an elegant strategy. But it is not the only way to own U.S. equities.
Behind the headline index sits an increasingly sophisticated family of strategies that invest in many of the same companies while allocating capital according to very different characteristics. Some favour companies with stronger profitability and balance sheets. Others favour stocks exhibiting persistent price momentum. Some deliberately reduce exposure to volatile companies, while others focus on attractive valuations or reduce the dominance of the largest companies altogether.
These are commonly known as factor strategies. Their importance has grown as investors have become more aware that owning hundreds of stocks does not necessarily mean being broadly diversified across sources of return.
A market-cap-weighted portfolio can still be highly dependent on a relatively small number of mega-cap companies, sectors or investment styles.
Factor investing offers another way to think about U.S. equity exposure: not simply whether to own the S&P 500, but how to own it.
Key Takeaways
- The traditional S&P 500 is itself an investment strategy, predominantly weighting companies according to market capitalisation.
- Factor indices use alternative rules to select or weight securities according to characteristics such as Quality, Momentum, Value and Volatility.
- The same broad universe of U.S. companies can therefore produce materially different portfolios and investment outcomes.
- No factor consistently outperforms. Leadership changes substantially across market cycles.
- Momentum has been particularly strong recently, returning 23.9% through August 2026 compared with 13.1% for the S&P 500, but historical performance demonstrates that factor leadership can reverse.
- Low Volatility has historically behaved very differently, providing greater downside resilience in some difficult markets while often lagging during powerful rallies.
- Multi-factor strategies seek to diversify across several return drivers rather than relying on a single factor.
- Factor investing can help investors diversify not simply the securities they own, but the sources of risk and return within their equity allocation.
The S&P 500 Is Already an Investment Strategy
The S&P 500 is frequently treated as synonymous with the U.S. stock market.In reality, it incorporates an important portfolio-construction decision: companies are predominantly weighted according to their float-adjusted market capitalisation. As a company's market value increases, its influence on the index generally increases as well. This approach has significant advantages. Market-cap weighting is transparent, highly scalable and relatively inexpensive to replicate. It also allows successful companies to naturally become larger components of the portfolio.
But it has consequences.
When a relatively small number of very large companies dominate market performance, they also become increasingly important to the index. An investor can therefore own hundreds of companies while a considerably smaller number account for a significant proportion of portfolio performance and risk.
Factor investing begins with a different question: What happens if we continue investing in leading U.S. companies, but determine portfolio exposure using characteristics other than company size?
What Is Factor Investing?
A factor is a measurable characteristic of a security that can be used systematically in portfolio construction. Instead of allocating capital primarily according to market capitalisation, factor indices select or weight stocks according to characteristics linked to fundamentals, valuation, market behaviour or risk.S&P's August 2026 dashboard measures factors including Volatility, Momentum, Value, Beta, Dividend, Quality and Size, while its macroeconomic study examines Quality, Momentum, Growth, Value, Dividend, Low Volatility and Size.
The important word is systematically.
Factor investing sits between traditional passive and active management. Like passive investing, factor indices follow predefined and transparent methodologies. But like active management, those methodologies deliberately favour some securities over others:
- A Quality index expresses a systematic preference for stronger financial characteristics.
- A Momentum index favours companies with stronger recent price trends.
- A Low Volatility index deliberately changes the portfolio's sensitivity to market fluctuations.
- A Value index tilts toward securities trading at lower valuations relative to selected fundamentals.
Factor indices are therefore better understood as rules-based portfolio-construction strategies rather than neutral representations of the market.
Five Different Ways to Own the S&P 500
The easiest way to understand factor investing is to examine the question each strategy is trying to answer.Quality: Which Businesses Are Fundamentally Strongest?
Quality strategies seek companies displaying stronger financial characteristics. The S&P 500 Quality Index uses return on equity, accruals and financial leverage as its selection metrics. The index holds 100 constituents and weights them using float-adjusted market capitalisation multiplied by the company's Quality score.The intuition is straightforward. Companies with stronger profitability, cleaner earnings and healthier balance sheets may be better positioned to compound earnings over long periods and withstand periods of economic stress.
The trade-off is valuation. High-quality businesses are often widely recognised as such, which means investors may have to pay higher prices for them.
Quality asks: Which companies combine profitability with financial strength?
Momentum: Which Companies Are Already Winning?
Momentum takes a very different approach.Rather than asking whether a company is cheap or financially stronger, Momentum focuses on persistent price leadership. The S&P 500 Momentum Index measures 12-month risk-adjusted momentum. The factor dashboard describes Momentum using the total return over the prior 12 months, excluding the most recent month, adjusted for volatility.
The investment logic is behavioural as much as fundamental. Market trends can persist because information is incorporated gradually, investor positioning adjusts slowly and successful companies can continue to attract capital.
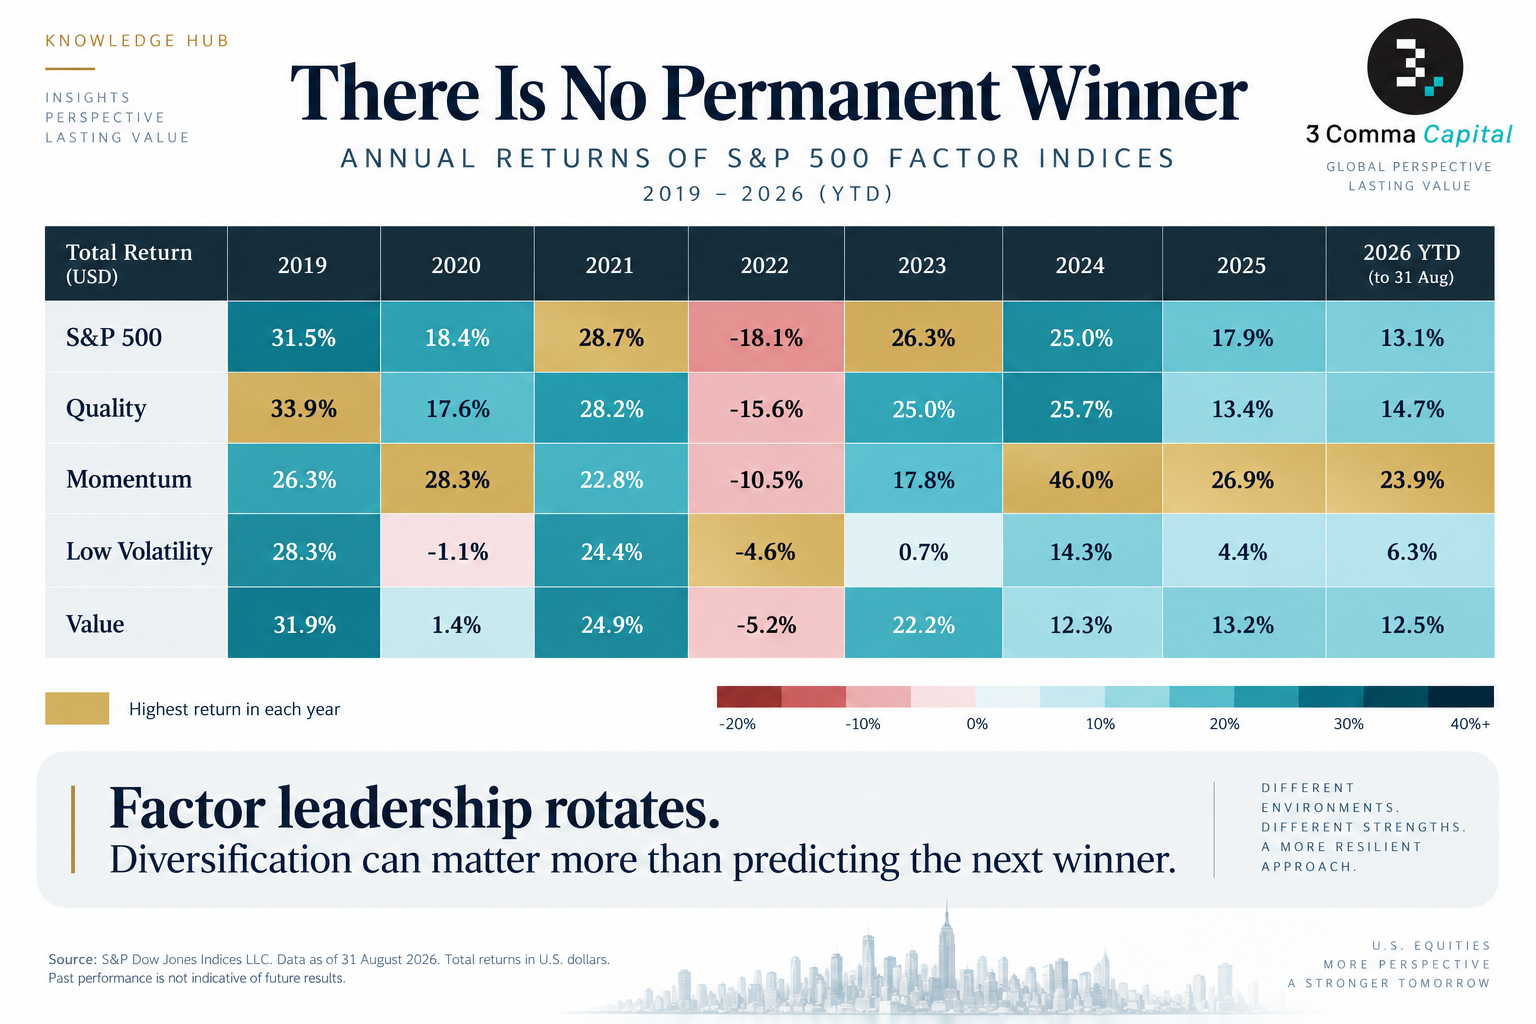
Recent performance illustrates the potential power of the factor: Momentum returned 46.0% in 2024, 26.9% in 2025 and 23.9% through August 2026, compared with 25.0%, 17.9% and 13.1%, respectively, for the S&P 500.
But Momentum also carries reversal risk. A strategy built around persistent winners can suffer when market leadership changes abruptly.
Momentum asks: Which companies are demonstrating the strongest persistent market trends?
Value: Where Are Investors Paying Less?
Value investing starts from one of the oldest principles in financial markets: the price paid for an asset matters.S&P's Value factor measurement combines earnings-to-price, book-to-price and sales-to-price measures. The objective is to identify companies whose prices appear attractive relative to their underlying fundamentals.
Value therefore often directs capital toward securities that investors have neglected or discounted. The underlying thesis is that markets can become excessively pessimistic and that valuations may eventually normalise as expectations or fundamentals improve.
But low valuations can persist. And some companies are inexpensive because their businesses genuinely face structural problems.
Value asks: Where are investors paying the least for underlying fundamentals?
Low Volatility: Can Equity Risk Be Taken Differently?
Low Volatility challenges another intuitive assumption: that maximising upside participation should always be the primary goal of equity investing. Instead, the strategy deliberately favours stocks with lower historical price variability.The S&P 500 Low Volatility Index selects 100 constituents and weights them inversely according to realised volatility. Its objective is not necessarily to outperform during powerful bull markets.
It is to participate differently.
The annual performance data make that contrast very clear: In 2022, when the S&P 500 declined 18.1%, Low Volatility declined only 4.6%.
But in 2023, when the S&P 500 rebounded 26.3%, Low Volatility returned only 0.7%.
That is the strategy in miniature. It may give up some upside participation in exchange for more defensive characteristics.
Low Volatility asks: Can investors maintain equity exposure while reducing sensitivity to market swings?
Equal Weight: What If Size Does Not Determine Importance?
Equal Weight is perhaps the easiest alternative construction methodology to understand. Instead of allowing the largest companies to dominate the portfolio, every S&P 500 constituent receives approximately the same weight when the index is rebalanced.S&P's macroeconomic study characterises the S&P 500 Equal Weight Index as holding all 500 constituents with equal weighting. The result is substantially lower mega-cap concentration and greater relative exposure to smaller companies within the S&P 500 universe.
It also introduces a systematic rebalancing mechanism.
Companies that have risen strongly become overweight relative to the equal-weight target and are trimmed. Relative laggards are increased back toward equal weight.
Equal Weight should therefore not be viewed simply as a less concentrated S&P 500. Its size exposure and rebalancing discipline can lead to materially different outcomes.
Equal Weight asks: What happens when company size no longer determines portfolio importance?
Same Market. Very Different Outcomes.
If factor investing were simply about finding a better version of the S&P 500, the decision would be easy.Historical results show why it is not.
The S&P Factor Dashboard presents annual returns for core factors going back to 2011. The more recent period illustrates just how dramatically leadership can rotate.
*2026 through August 31. Total returns in U.S. dollars. Source: S&P Dow Jones Indices.
The pattern is more important than any individual number:
- Momentum has dominated several recent periods.
- Low Volatility behaved much better during the 2022 drawdown but lagged sharply during subsequent rallies.
- Quality has periodically outperformed the benchmark but has not done so consistently.
- Value has moved through its own cycles.
And the traditional S&P 500 itself has often been the strongest option.
There is no permanent winner. That is one of the most important lessons of factor investing.
Factor Performance Changes With the Economic Environment
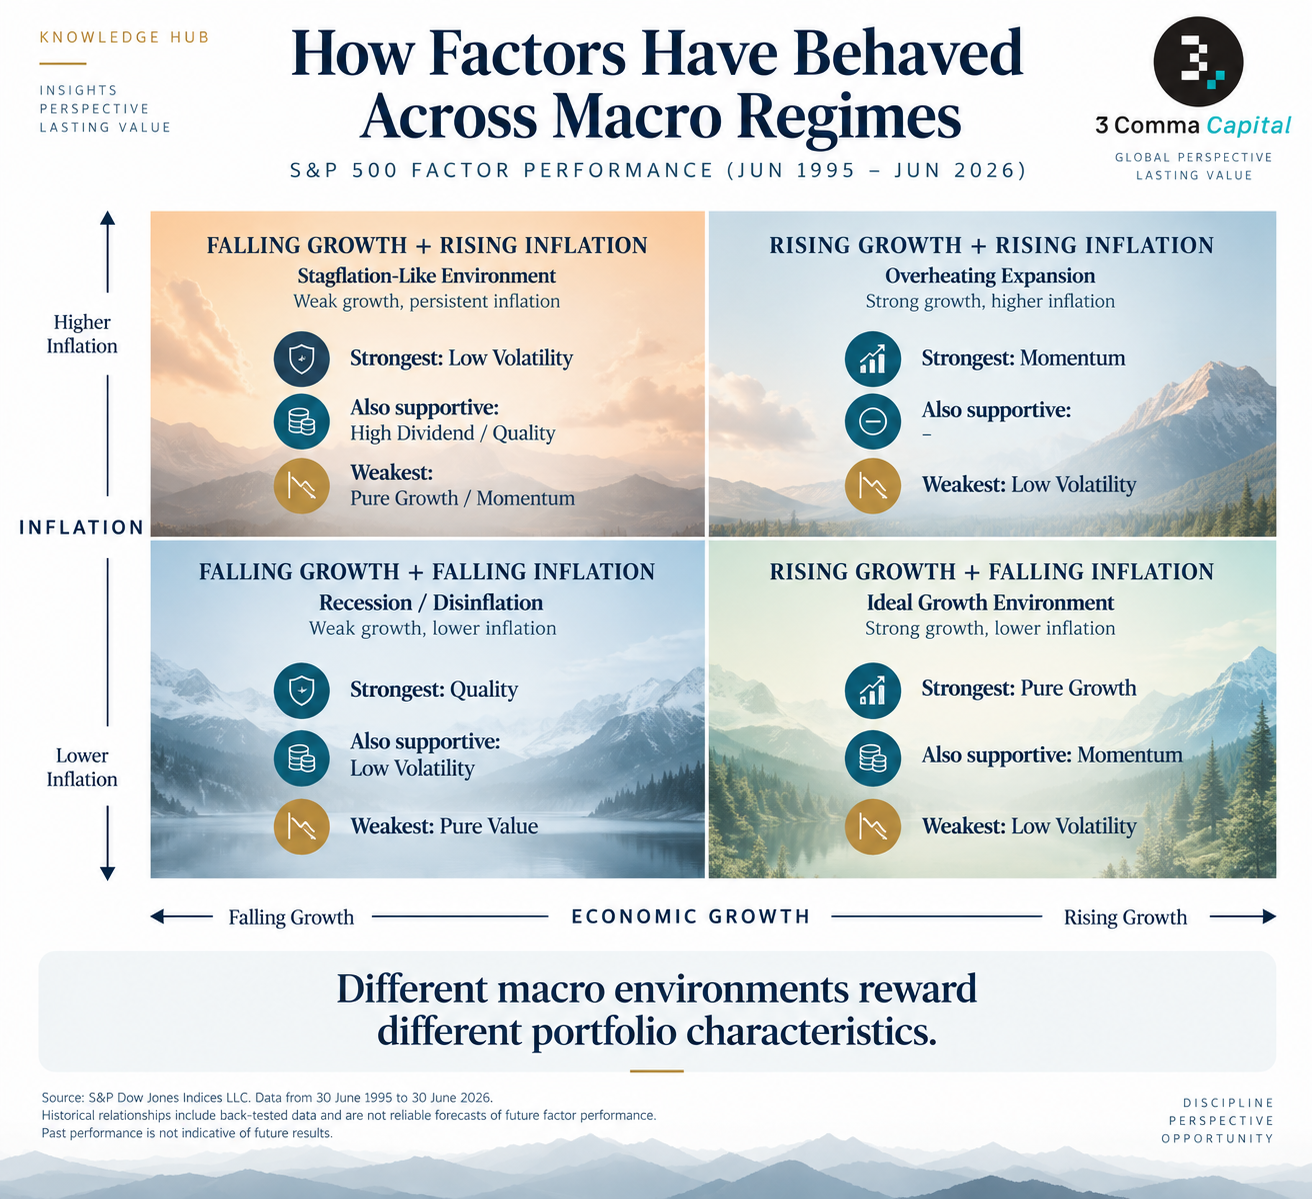
Factor leadership does not occur in a vacuum. A separate S&P Dow Jones Indices study examined factor behaviour across four macroeconomic regimes defined by growth and inflation over the period from June 1995 to June 2026.The framework is deliberately simple.
Growth is classified as rising or falling using monthly changes in the OECD U.S. Composite Leading Indicator.
Inflation is classified as rising or falling by comparing the three-month average of U.S. CPI with its three-year moving average.
To reduce noise, a regime must persist for at least three months before being recognised.
This produces four environments:
- Rising Growth + Falling Inflation
- Rising Growth + Rising Inflation
- Falling Growth + Falling Inflation
- Falling Growth + Rising Inflation
The results are revealing. Across the full period, the S&P 500 itself generated its strongest historical annualised performance in the Rising Growth + Falling Inflation regime and its weakest performance in the Falling Growth + Rising Inflation regime.
Factor leadership also changed materially from one regime to another.
Rising Growth + Falling Inflation
Historically, this has been the most supportive regime for equities.The S&P study found Pure Growth to be the strongest active factor in this environment, generating an average monthly excess return of 0.58% over the S&P 500 with an outperformance hit ratio of 63%.
Low Volatility was the weakest factor, with an average monthly excess return of -0.85% and an outperformance hit ratio of only 33%.
The intuition is relatively straightforward.
Improving growth and declining inflation can support corporate earnings while easing pressure on discount rates and financial conditions. In such an environment, investors have historically been willing to reward growth and market leadership rather than defensive characteristics.
Rising Growth + Rising Inflation
When growth remains strong but inflation is increasing, Momentum historically stood out.S&P found Momentum generated an average monthly excess return of 1.07%, the strongest result among the factors examined in that regime, with an outperformance hit ratio of 63%.
Low Volatility again lagged, with an average excess return of -0.82%.
Momentum's historical strength in this environment is consistent with the idea that persistent market leadership can continue even as inflationary pressures build, provided economic activity remains strong.
Falling Growth + Falling Inflation
The picture changes when economic growth weakens. In this regime, Quality was historically the strongest active factor, generating an average monthly excess return of 0.39% with an outperformance hit ratio of 64%.Pure Value was the weakest factor, with an average monthly excess return of -0.75%.
This is particularly relevant because it reveals a defensive dimension to Quality.
Quality is not simply about owning fundamentally stronger companies. Historically, its relative performance has improved when economic growth weakened.
Falling Growth + Rising Inflation
This is historically the most difficult combination for the broad equity market. Growth is weakening while inflation remains elevated.In this environment, Low Volatility was the strongest factor in S&P's study, generating an average monthly excess return of 1.19% and outperforming the S&P 500 in 64% of months. High Dividend also performed strongly, while Quality remained positive. Pure Growth and Momentum, by contrast, were among the weaker strategies.
The broader lesson is clear: different factors provide exposure to different economic risks.
Growth and Momentum have historically benefited more from improving economic activity. Quality and Low Volatility have tended to become more useful as growth weakened. Dividend strategies have historically become more attractive in some environments where investors placed greater emphasis on income and stability.
Why This Does Not Mean Investors Can Time Factors Easily
The macroeconomic evidence is useful. It can also be dangerous if interpreted too literally. Looking backwards, factor rotation appears almost obvious.Why not simply own Momentum when growth is improving, switch into Low Volatility as the cycle deteriorates and rotate into Value when the recovery begins?
Because investors only know the regime with certainty after much of the market adjustment may already have occurred.
Markets are forward-looking. Economic data is revised. Policy changes can alter conditions rapidly. And factor performance can turn before macroeconomic indicators provide a clear signal.
The S&P research itself illustrates the problem:
- Momentum performed strongly in rising-growth regimes but its relative advantage disappeared in the more difficult falling-growth, rising-inflation environment.
- Low Volatility showed almost the opposite pattern: weak relative performance during rising-growth regimes and much stronger performance when growth weakened.
An investor who simply buys the factor that has performed best recently may therefore position the portfolio for the regime that is already ending. This is factor timing risk.
Knowing that regimes exist is not the same as being able to predict their turning points consistently. That is one reason diversification across factors can be more robust than attempting to identify the next winner.
Multi-Factor Investing: What If We Do Not Have to Choose?
One response to factor timing risk is not to choose a single factor at all. Multi-factor strategies combine several characteristics within one systematic portfolio.Quality, Value and Momentum (QVM) are particularly complementary conceptually:
- Quality can identify strong businesses, but those businesses may be expensive.
- Value can identify inexpensive securities, but low valuations can sometimes reflect weak fundamentals.
- Momentum can capture market leadership, but strong trends can reverse.
Combining the three can create a more balanced selection framework.
Rather than asking only:
Is this a strong business?
or:
Is this company cheap?
or:
Is its share price performing strongly?
a multi-factor strategy can ask: Which companies offer the strongest combination of fundamental quality, valuation and market behaviour?
The objective is not to guarantee outperformance. It is to reduce dependence on any single factor remaining in favour.
Factor Rotation: A More Dynamic Alternative
There is another possible response to changing factor leadership. Instead of maintaining diversified exposure across several factors, a systematic methodology can attempt to rotate toward the factors displaying stronger signals.This creates three broad approaches:
Single Factor
Maintain exposure to one characteristic.Multi-Factor
Combine several characteristics simultaneously.Factor Rotation
Systematically change factor exposure using predefined rules.These approaches solve different problems:
- A single-factor strategy expresses a clear conviction.
- A multi-factor strategy accepts uncertainty and diversifies across return drivers.
- A factor-rotation strategy attempts to exploit changing leadership dynamically.
None eliminates risk. They simply allocate it differently.
Factor Investing Is Not Free Diversification
Factor strategies can broaden diversification, but they also introduce their own risks:Tracking Error
A factor portfolio can behave very differently from the S&P 500 for extended periods. That means an investor must be comfortable looking wrong relative to the benchmark, sometimes for years.Sector and Stock Concentration
Factor methodologies can create unintended concentrations.- Momentum may become dominated by the sectors currently leading the market.
- Quality may favour sectors with structurally stronger profitability and balance sheets.
- Value may become concentrated in slower-growth areas.
Turnover
Some strategies rebalance more aggressively than traditional market-cap-weighted indices. Higher turnover can increase implementation costs and taxes, depending on the vehicle and jurisdiction.Methodology Risk
Two indices carrying the same factor label may define it differently. The word Quality is not a methodology. The underlying metrics, weighting rules, constraints and rebalance schedule matter.Factor Crowding
If large amounts of capital chase the same characteristics, valuations can become stretched. A factor may still have strong historical logic while offering less attractive prospective returns at an extreme valuation.Back-Test Risk
This point is particularly important. Several of the S&P factor indices analysed historically were launched well after the beginning of the performance period used in the research.For example, the Quality Index was launched in 2014, Momentum in 2014 and Low Volatility in 2011. Performance before those dates is therefore hypothetical and back-tested. Back-tested results benefit from hindsight and do not represent actual investment experience.
Historical research remains useful. It should not be mistaken for a live track record.
From Diversifying Stocks to Diversifying Return Drivers
Traditional diversification asks: How many investments do I own?Modern portfolio construction asks another question: What is actually driving their returns?
Consider an investor who holds the S&P 500, the Nasdaq 100 and a U.S. technology fund. On paper, that investor owns three different investments.
Economically, however, all three may depend heavily on many of the same mega-cap companies, valuation assumptions and growth expectations. The number of holdings alone therefore tells us relatively little about genuine diversification.
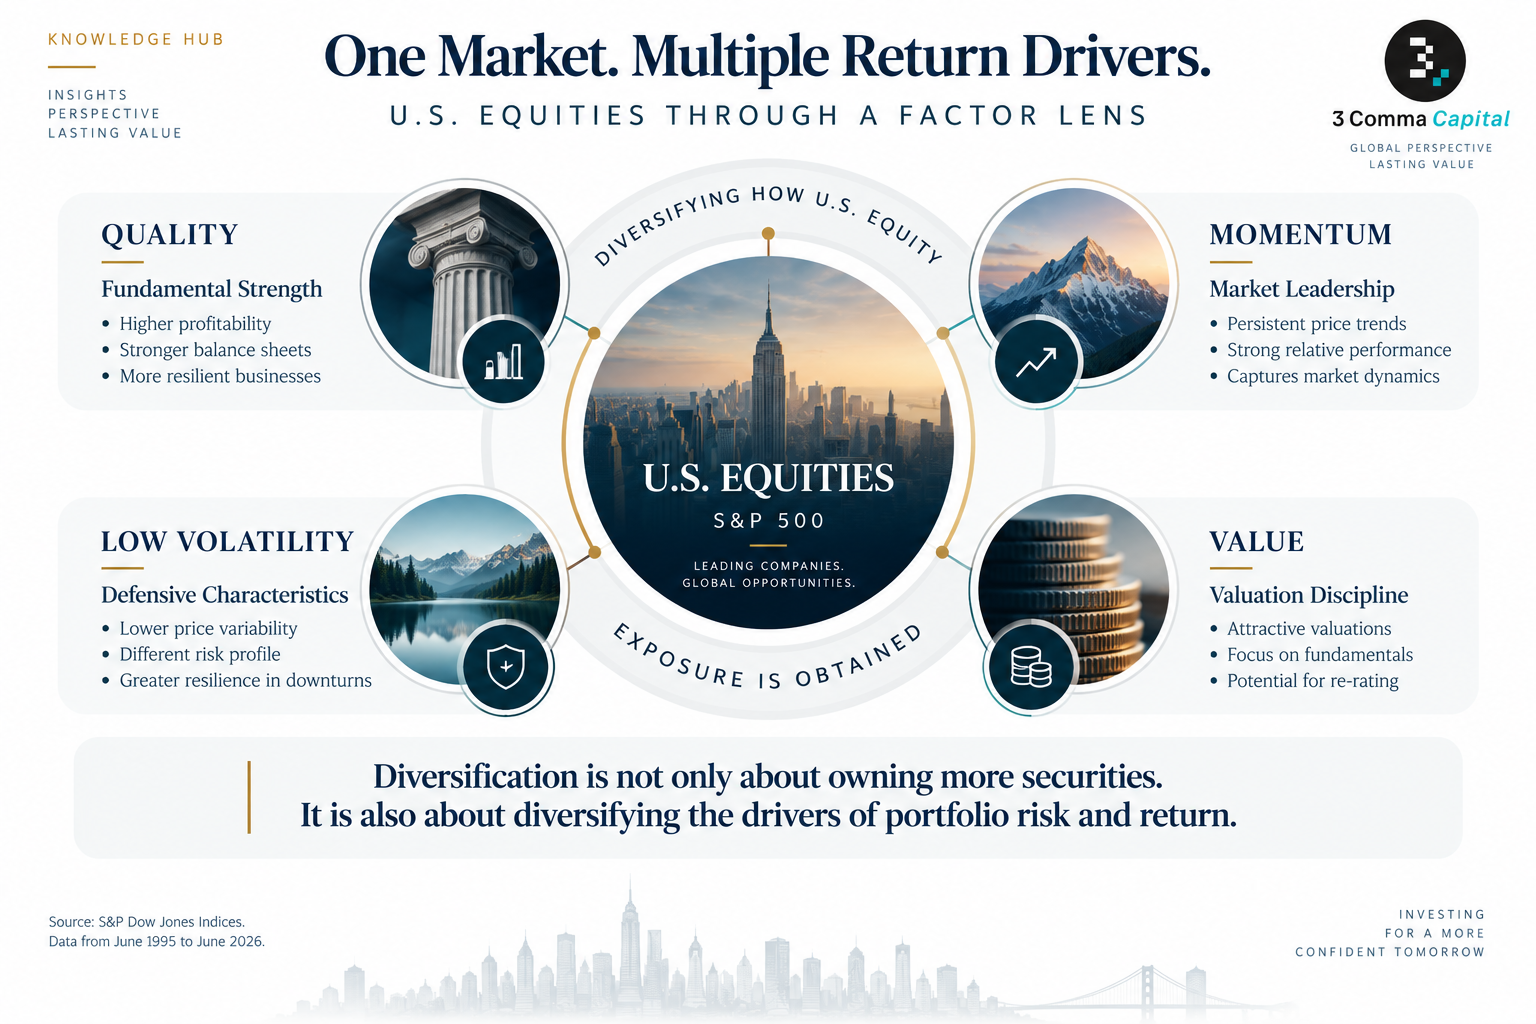
Factor investing introduces another dimension:
- Quality provides exposure to financial strength.
- Momentum captures market leadership.
- Value introduces valuation discipline.
- Low Volatility changes the portfolio's risk characteristics.
- Equal Weight reduces dependence on the largest companies.
Investors can therefore diversify not only what they own, but also why those investments are expected to generate returns.
This broader idea of multidimensional diversification extends beyond portfolio construction. As we explored in Why Global Families Are Diversifying More Than Their Portfolios, diversification increasingly involves understanding multiple sources of financial and structural risk.
How We Think About Factor Diversification at 3 Comma Capital
At 3 Comma Capital, we remain constructive on U.S. equities, but elevated valuations and high real yields argue for being more deliberate about how that exposure is obtained.That distinction matters. Factor diversification is not necessarily a bearish view on the S&P 500. Nor does it forecast an end to mega-cap leadership.
It is about diversifying the architecture of U.S. equity exposure itself:
- Quality can increase exposure to financially stronger businesses and has historically displayed greater resilience in weaker-growth environments.
- Momentum can capture persistent market leadership and has historically performed most strongly when growth conditions were improving.
- Low Volatility can materially alter downside characteristics and historically performed best relative to the S&P 500 in falling-growth regimes.
- Value introduces a different source of return based on valuation discipline and can benefit when market leadership broadens.
Multi-factor strategies can combine several of these characteristics rather than relying excessively on a single style or economic regime. The objective is not to predict which factor will outperform next month.
It is to recognise that each factor responds differently to the underlying economic environment.
Beyond Passive Versus Active
For years, the investment debate was framed as a binary choice: Active management or passive indexing.Factor investing makes that distinction increasingly incomplete. Investors can now access systematic portfolios designed around profitability, valuation, momentum, volatility, dividends, company size and combinations of several characteristics.
These strategies remain rules-based. But they are not neutral. Every methodology expresses a view about which characteristics should determine portfolio exposure.
Market-cap weighting expresses one view.
Equal weighting expresses another.
Quality, Momentum, Value and Low Volatility each express others.
The more useful question is therefore no longer simply: Active or passive?
It is increasingly: Which portfolio-construction methodology best reflects the risks and returns the investor actually wants to own?
The Bottom Line
The S&P 500 remains one of the world's most important equity benchmarks and one of the most effective ways to obtain broad exposure to leading U.S. companies. Factor investing does not invalidate that approach. It expands the toolkit. The same underlying market can be approached through profitability, valuation, momentum, volatility, size, income or combinations of several characteristics. Historical evidence shows that these approaches can behave very differently.It also demonstrates something more important: there is no permanently superior factor:
- Momentum can dominate during one market environment and reverse in another.
- Low Volatility can provide meaningful downside resilience while lagging significantly during a strong bull market.
- Quality can offer exposure to stronger fundamentals without guaranteeing superior returns.
- Value can remain out of favour for extended periods before conditions change.
The opportunity is therefore not necessarily to identify the next winning factor. It is to recognise that different portfolio characteristics respond differently to different economic environments.
And if investors cannot reliably know which environment will dominate next, diversifying factor exposures may be more robust than attempting to forecast the next winner. For long-term investors seeking exposure to corporate America, the question may therefore no longer be simply whether to own the S&P 500.
It may also be:
How do you want to own it?
Source and Risk Note
The recent performance figures and factor characteristics referenced in this article are principally based on the S&P 500 Factor Indices Dashboard, August 2026, with data through August 31, 2026.
The macroeconomic-regime analysis is based on A Historical Perspective on Factor Index Performance across Macroeconomic Cycles, published by S&P Dow Jones Indices in August 2026 and covering historical data from June 1995 to June 2026. Some historical index results predate the live launch dates of the relevant indices and are therefore hypothetical and back-tested. Back-tested performance benefits from hindsight, does not reflect actual investment experience and may differ materially from live results. Past performance, whether actual or hypothetical, is not indicative of future results. Factor strategies may experience extended periods of underperformance, tracking error, concentration, higher turnover and methodology-specific risks. This article is for informational purposes only and does not constitute investment advice or a recommendation to invest in any particular security, index, fund or strategy.
The macroeconomic-regime analysis is based on A Historical Perspective on Factor Index Performance across Macroeconomic Cycles, published by S&P Dow Jones Indices in August 2026 and covering historical data from June 1995 to June 2026. Some historical index results predate the live launch dates of the relevant indices and are therefore hypothetical and back-tested. Back-tested performance benefits from hindsight, does not reflect actual investment experience and may differ materially from live results. Past performance, whether actual or hypothetical, is not indicative of future results. Factor strategies may experience extended periods of underperformance, tracking error, concentration, higher turnover and methodology-specific risks. This article is for informational purposes only and does not constitute investment advice or a recommendation to invest in any particular security, index, fund or strategy.
 |
Investments Principal
|
With more than 20 years of experience in financial markets, Duarte specialized in the energy area in the last decade, where he had the opportunity to work with the main European Power and Gas institutions at CIMD Group. Previously, he worked as Market Strategist at IG Markets Iberia.
More about Duarte Caldas


